| Epicenter Near | Magnitude | Depth (km) | Local Time |
|---|---|---|---|
| ALTARNUN,CORNWALL | 1.4 | 5 | 24/04/2024 01:50 |
| TREGARON,CEREDIGION | 2.3 | 4 | 22/04/2024 10:09 |
| LLANGURIG,POWYS | 1.0 | 7 | 22/04/2024 09:37 |
| BELPER,DERBYSHIRE | 2.5 | 7 | 19/04/2024 02:42 |
| AUCKLEY,SOUTH YORKSHIRE | 1.4 | 2 | 18/04/2024 19:36 |
| SOUTHERN NORTH SEA | 3.0 | 11 | 18/04/2024 03:52 |
| SKIPNESS,ARGYLL & BUTE | 0.7 | 7 | 18/04/2024 01:15 |
| NEWPORT,STAFFORDSHIRE | 1.5 | 7 | 17/04/2024 18:43 |
| CONSTANTINE,CORNWALL | 0.2 | 7 | 14/04/2024 15:04 |
| IRISH SEA | 0.9 | 7 | 13/04/2024 05:20 |
| KILNSEY,N YORKSHIRE | 1.0 | 2 | 10/04/2024 05:36 |
| APPLEY BRIDGE,LANCS | 1.7 | 9 | 05/04/2024 03:28 |
| NEW LUCE,D & G | 0.3 | 4 | 29/03/2024 05:45 |
| ST CLEARS,CARMARTH | 1.0 | 4 | 28/03/2024 01:47 |
| EASCAIRT,ARGYLL & BUTE | 0.7 | 14 | 26/03/2024 18:17 |
| DALCHREICHART,HIGHLAND | 1.2 | 2 | 25/03/2024 13:44 |
| NORTHERN NORTH SEA | 3.2 | 10 | 23/03/2024 11:47 |
| KIRKBY,CUMBRIA | 1.9 | 10 | 22/03/2024 04:28 |
| KIRKBY,CUMBRIA | 0.4 | 7 | 16/03/2024 14:57 |
| SWABY,LINCOLNSHIRE | 2.0 | 17 | 13/03/2024 14:49 |
| KELSALL,CHESHIRE | 0.9 | 17 | 10/03/2024 21:36 |
| MUSDALE,ARGYLL & BUTE | 1.0 | 11 | 10/03/2024 04:29 |
| HIGHBRIDGE,SOMERSET | 1.5 | 7 | 09/03/2024 01:17 |
| HIGHBRIDGE,SOMERSET | 0.7 | 7 | 09/03/2024 01:16 |
| MATLOCK,DERBYSHIRE | 1.8 | 2 | 07/03/2024 15:19 |
| SOUND OF MULL | 0.5 | 7 | 03/03/2024 21:53 |
| LLANGWM,CONWY | 0.9 | 12 | 03/03/2024 12:06 |
| LLANBEDR,GWYNEDD | 0.5 | 11 | 02/03/2024 06:25 |
| MORVERN,HIGHLAND | 0.7 | 7 | 29/02/2024 20:28 |
| MORVERN,HIGHLAND | 1.5 | 8 | 27/02/2024 05:56 |
| LETTERS,HIGHLAND | 1.2 | 2 | 25/02/2024 20:48 |
| TORRIDON,HIGHLAND | 0.5 | 7 | 25/02/2024 03:23 |
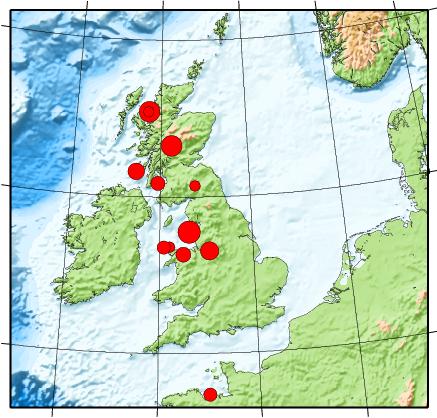
32 UK Earthquakes in the last 50 days.
Reproduced with the permission of the British Geological Survey © NERC. All rights Reserved.